Crash Mapping
Tools for visualizing and analyzing vehicle collisions
Why
The Crash Studies Team at UDOT's Traffic & Safety Division maintains a detailed database of all crashes on public roadways in Utah. This data is used to report safety trends, identify potential safety improvement projects, and allocate limited funding to projects that will have the greatest impact on safety. This data and all UDOT Safety Program information are protected under 23 USC 409 and therefore inadmissible in court.
Data Origination
All public safety agencies in Utah submit digital crash reports to the Department of Public Safety for all vehicle crashes on public roads in Utah. These reports capture detailed information about many contributing factors of the incident. UDOT processes the report to enhance and reconcile any issues with the data in the report and assure that the geo-location is correct. The geo-location is stored in UTM coordinates using NAD 83 Zone 12N projection. UDOT pushes updates of the data after a thorough review process to a secure location within DTS for use in the crash mapping application. Forklift processes the data, transforming it into an easy to query and visualize format for the web app.
Challenges
UDOT and the Department of Public Safety are committed to providing the highest quality of data available. However, we cannot guarantee that all crashes are represented in the data nor can we guarantee that all details pertaining to a crash are 100% accurate.
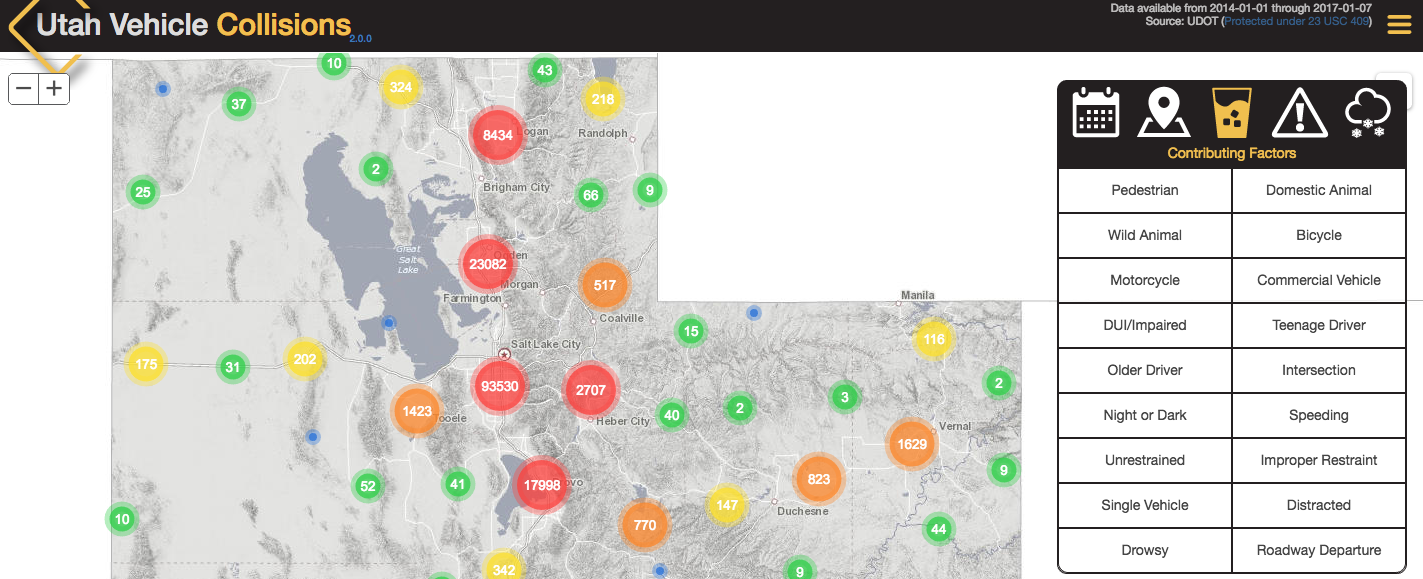
Visualizing vehicle crashes in Utah presents some fun challenges. Unfortunately, high volumes of vehicle collisions take place on Utah's roads annually and the crash mapping application displays data for multiple years. The best technique to visually comprehend massive amounts of point data is to cluster the points. This process creates one point which consumes the other points near it. Clustering drastically reduces the number of points visible making it easier to understand what you are looking at.
In order to accurately create the point clusters, all of the point data is required. Currently this is millions of points and growing. Optimizing the point data for clustering while still enabling the collision information to be quickly retrieved and filtered was a challenge. To overcome this challenge, AGRC created the absolute minimum required information in a json file. The file contains the primary key of the collision record and its' generalized geometry. The clustering system uses the generalized geometry to create accurate point clusters. A feature service, acting as an operational layer, allows the application to query specific records using the primary key and retrieve finer grain details about the crash.
Filtering of the collision data consists of a query to the feature service and a resulting array of primary keys being sent to the clustering engine. The collision geometries are only sent to the client once. This creates a slower time to first interactivity, but the subsequent querying and filtering are super fast.